MALMS Dashboard

maintenance and management

Dashboard Overview

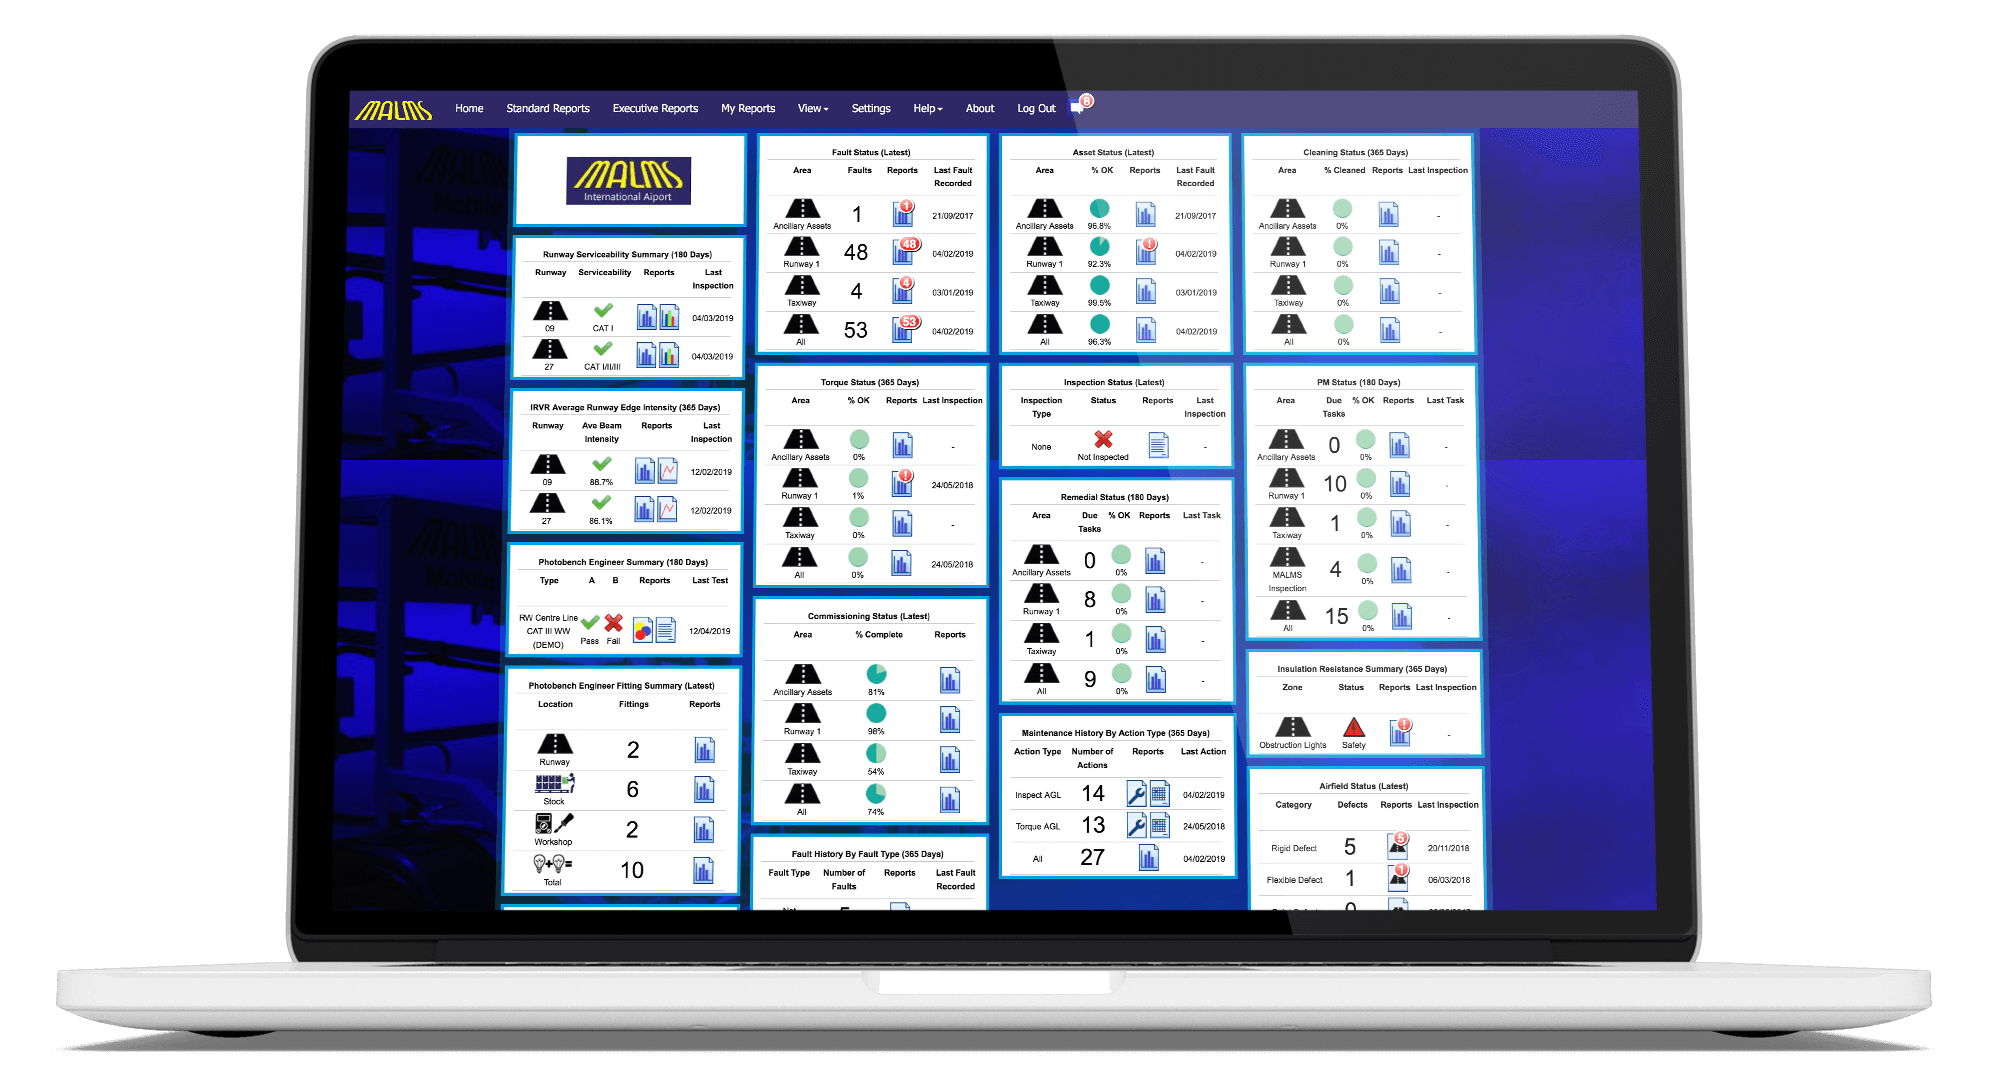
A web-based solution for the monitoring of MALMS airfield lighting maintenance and asset management.

MALMS Dashboard is a predominately cloud based solution, but can also be made available on a local airport server where all maintenance and inspection data is synchronised with a 4G/wifi capable PC tablet. Data collected by airport engineers/electricians such as photometric test results, lighting inspections, faults and maintenance recording, preventative and remedial maintenance tasks, as well as pavement issues can all be viewed in real time by accessing the MALMS Dashboard from any internet capable device.

MALMS Dashboard users can configure the settings to their own preference. As well as seeing the data from a dashboard, data can also be viewed from an online map, a calendar or from an asset tree structure. Customised email trigger reporting is a key feature of the MALMS Dashboard allowing users to be notified when maintenance, inspections and photometric tests have been completed.
Benefits

MALMS Dashboard provides the following distinct activities

  • live-cloud-reporting

    Live Dashboard Data

    The main dashboard screen provides up to the minute live data for faults, inspection status, MALMS Photometric runway serviceability, torque status, cleaning status and much more.

  • Computer

    Dashboard Alerts

    The dashboard flags up warnings and alerts for things that are wrong. For example If the serviceability level of the main runway falls below 95% it is shown as an alarm, or multiple faults which are over 30 days old are indicated for attention. A rolling news feed shows new alarms, due inspections and links to new data that you need to review.

  • drill-down

    Drill Down Function

    From the dashboard it is possible to drill down to reports containing further information about an item. You can click on an area of the runway, then drill down into a zone and then drill down again to the asset level. Reports have a consistent layout across different aspects of the system.

  • Audit-trail

    Customisable

    The whole system is user configurable including the dashboard layout, the data periods for standard reports, report parameters and email configuration. It is also possible to configure custom reports in the My Reports section.

  • Complience-tick

    Photometric Compliance

    A full library of Photometric Reports are included from the original MALMS Office software, which the dashboard now replaces. From Runway Serviceability, to Course Bar Charts and Isocandela Reports. Trends are now included for photometric analysis.

  • Serviceability

    MALMS Engineer Data

    A full library of reports are included Torque Status, Cleaning Information, Maintenance History, Fault Status, Civils Status and many more. You can keep track of all aspects of the MALMS Engineer system from one place.

  • Drill-Down

    Photobench Integration

    The very latest Photobench Engineer software now sends live test data to the cloud. This integrates with MALMS Engineer so that assets can be tracked through the workshop process. Test results are available from the dashboard as well as mean time to failure statistics for different types of lamps.

  • email-alerts

    Email Reports

    Exception based email reports can be sent as soon as a visual inspection, preventative maintenance cycle or MALMS Photometric survey is completed. Also daily, weekly or monthly management level reports can be automatically sent out on a regular basis without the need to visit the cloud.

  • executive-reports

    Executive Summary Reports

    Management level summary reports including top level information about all aspects of the system are available. The reports are available for custom time periods, with or without charts. Most useful as part of the email reports system, but available from the dashboard too.

  • email-alerts

    Alternative Data Views

    Reports can be visualised in the form of a map, which is also an excellent interface to select assets and drive further reports. A tree view of assets is also available to visualise data within the airfield structure. A calendar view drives reports from past inspection events and also shows upcoming inspections and preventative maintenance schedules.

  • light-inspection

    Data Analysis

    From the map view it is possible to analyse fault and maintenance hotspots. Runway areas where frequent torque maintenance is required can also be highlighted. From a complete history of maintenance for an individual asset, mean time to failure can be estimated based on photometric performance.

  • Airport-systme

    System Integration

    Report data can be exported to CSV format which may be imported into a variety of applications. Custom integration with third party systems via SQL, XML, JSON or other interfaces can be developed on request, please ask us for more information.

MALMS Dashboard

CLOUD BASED RUNWAY TAXIWAY LIGHT INSPECTION EASY TO USE FAULT FINDING

Providing airport operators with fast and effective methods for cleaning runway and taxiway lights.
click
Dashboard Expertise

Monitoring your airfield assets could not be easier

The MALMS Dashboard is designed to give airports information in a modern and easy to use high level summary with drill down functionality to data on individual light assets. The MALMS Dashboard can be configured based on airports maintenance programs such as 30/60/90 day cycle.

0+

Airports worldwide and growing
man-using-tablet